Well, VMMap crashed, so that's a good start. I'll try it again. I closed the RDP session and when I came back a while later it wasn't there, although Opus was running. RDP is V6.3.9600.
VMMap seems to crash every time. It works for a while, I go away for a few hours and come back to find it's just gone with no error message or explanation.
Yeah, so we are kind of screwed because if you are having the same experience there is pretty much no chance I am going to get it to run for a week or two.
VMMap uses a lot of memory while tracing. (It has to, it's recording a lot of information.) So it will run out of memory and crash if you leave it running for more than a short time.
If it doesn't survive long enough to disconnect and reconnect to the RDP session then we are in trouble, though. 
FWIW, I tried lots of RDP re-connections earlier and Opus's memory usage remained stable. That was with:
[ul][li]Windows 7 x86 to Windows 7 x64.[/li]
[li]Drives and Clipboard being shared (no printer, though).[/li]
[li]Themes enabled, but Desktop Composition disabled.[/li]
[li]Everything else set to the settings you get if you choose the highest bandwidth mode.[/li]
[li]Over gigabit ethernet.[/li][/ul]
I don't think it is the RDP connect/disconnect specifically that causes it. All I said was that when something breaks and it starts chewing up memory it allocates twice as much every time you start an RDP session.
It seems that there is no way to diagnose this problem. Well, the developers could do it with their IDE/debugger, but they can't reproduce it. Could you make a test binary that dumps out debug information on demand?
Debug information about what, exactly?
I don't know what compilers/frameworks/debuggers you use but often there is a way to dump a stack trace or list of memory allocations. I'm an embedded programmer so I'm not all that family with desktop stuff but IIRC there is run-time performance monitoring stuff for the Microsoft C++ compiler... Yeah, CRT Debug I think, monitors all heap allocations. There is still for GCC as well, of course. VMMap can't be the only memory debugger you can use.
A list of memory allocations won't say anything about which component or piece of code allocated them, which is what we need to know. The only place Windows records which component allocated memory is with some memory allocations made by drivers, which are unlikely to apply here.
that is not entirely true. _CrtDumpMemoryLeaks will dump first few bytes of each leaked object which will hold the address of vtable pointer which is unique for every class with virtual members you have.
That is assuming the large memory allocations are C++ objects, and objects with virtual functions, and that the vpointer can be interpreted just from the number (all possible but unlikely) and that, if all are true, it's an Opus object and not something from Windows, a shell extension, or another component (where we'd be unable to interpret the pointer even if the number really was a pointer).
It's possible to view those bytes using VMMap and other debugging tools anyway. We don't need to build a special exe to enable it. If you can reproduce the problem and spot a pattern in the memory, let us know. I think it's unlikely though.
Focusing on finding a reliable way to reproduce the problem(s) is probably better, if we can't get a VMMap trace to work. (I say problems because I am still not convinced the few reports here are all the same thing. Lots of things can cause memory leaks and the reports have very different takes on what causes it for them.)
Have just had DOpus complaining about memory usage. Remember reading this thread about memory usage.
Was not doing anything different than I have done before.
Programs open
Dopus 11.4
IE11
Microsoft Photo Gallery
Nero 14 (burning some disks)
Epson print CD (printing labels for disks)
Google Chrome [Chekink version number}
Shut down Chrome and Epson Print Cd as finished with them
Got message again from Dopus
Shut down IE11 Microsoft Photo Gallery as finished using them.
Started Resource Monitor and found that it was DOpus that was using the memory
Started VMMap
Have attached a screen capture of VMMap.
Hope this will Help
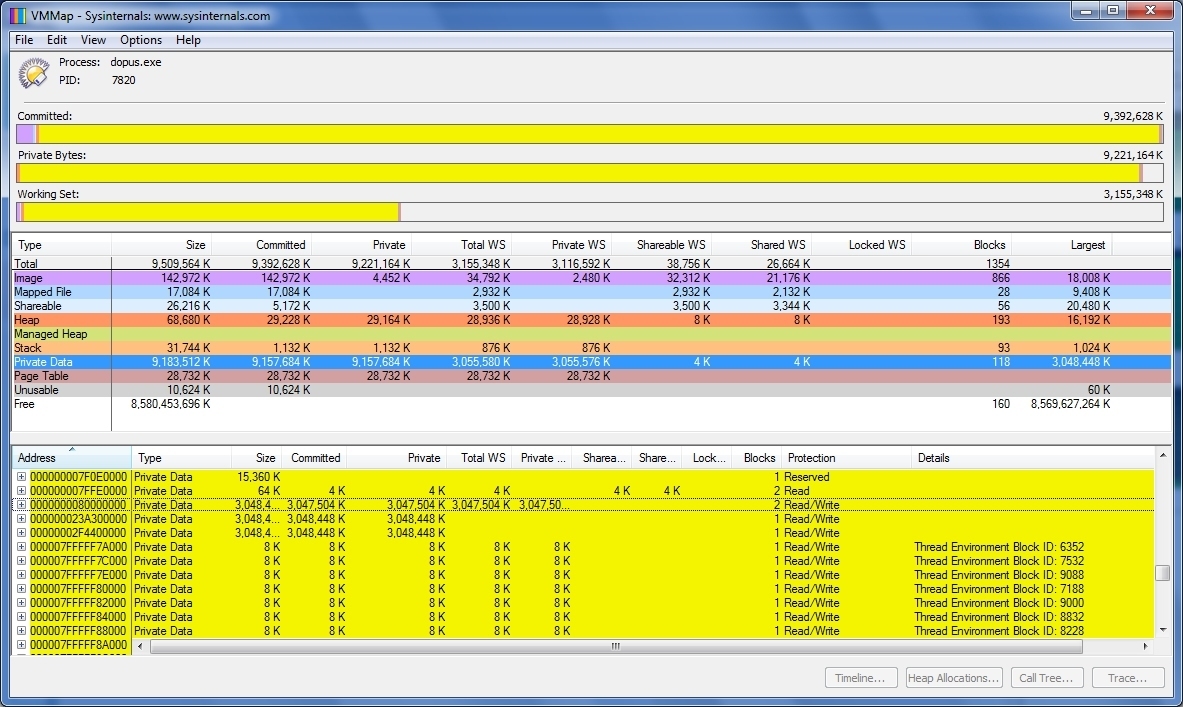
That screenshot only really tells us that a lot of memory has been allocated by dopus.exe. It doesn't tell us which component allocated it.
Please follow the steps in How to find components causing memory leaks, and please start a new thread if you get results from those steps.
A description of what was happening when the leak occurred is also important. It might not be anything unusual to you, but we don't know what your usual is.  The types of files being looked at around the time the leak happened are often important. As are things like right-clicking files, or changing to folders you don't often go into, both of which can trigger shell extensions and video codecs, which are almost always the causes of memory leaks. If a viewer is open or was recently used, that's also worth mentioning, along with the file types involved.
I've locked this thread as it has become a generic place to report (almost certainly unrelated) memory leaks, and has so much discussion that people are not finding the important parts & not noticing/following the guide.
Remember that memory leaks can be caused by a lot of different things, most of them 3rd party components which are loaded into Opus. You need to follow the guide I linked to work out which component is causing the leak, and post that information to the forum.