From the 2nd PML log you sent, Opus is using very little CPU and is not doing much at all, but almost all of its operations are due to page faults (some taking a very long time), which means the machine is so low on memory that parts of dopus.exe (and probably other processes) have been flushed from memory and back to the HDD.
Once that starts happening, almost everything on the machine will be incredibly slow, since what was an extremely quick memory access will turn into an extremely slow disk access.
The log shows other programs having similar problems, most notably the Trend Micro anti-virus scanner (ntrtscan.exe), which is also spending a lot of time paging data. (I'm not sure if it is performing a virus scan as well, which might slow things down even more as the disk is the bottleneck once the system starts paging, but I don't think the virus scanner is causing the problems, at least from what's in the log. It is using a fair amount of CPU, but probably not enough for that to be what's slowing things down; it uses about 2 minutes of CPU time over the 8 minute window. That may mean it is maxing out one CPU if you have 4-CPU machine.)
Neither the virus scan nor Opus appear to be using a great deal of memory, but there are several processes using a lot of memory (e.g. ColdFusion using 500MB, Java using 70MB-170MB, SQL Server using about 200MB, another service using 250MB).
All that memory usage plus the way Opus and other processes are spending huge amounts of time hitting the page file suggests that your machine is simply running out of physical memory, and having to use virtual memory which is orders of magnitude slower.
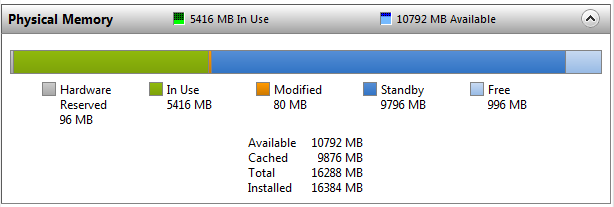
Have a look at the memory tab in Resource Monitor, especially the Physical Memory graph at the bottom. If that shows all memory In Use or Modified when things are slow, then the slowness is because you are out of RAM.
Normally, when things are running smoothly, you'd see something more like this, where some RAM is In Use but most is Standby or Free: