Blue Screen Of Death - BAD_POOL_CALLER

Hello, I'm getting this Blue screen of death periodically with Opus 9.1.1.8.3357.x86

I could use some help to make sense of it. Here is the dump analysis:

Can you tell me what this means and what I should do? I've even gone as far as reimaged the machine and installed fresh.


Microsoft (R) Windows Debugger Version 6.11.0001.404 X86
Copyright (c) Microsoft Corporation. All rights reserved.


Loading Dump File [C:\Downloads\Dumps\D090418 - 1850\Mini041809-02.dmp]
Mini Kernel Dump File: Only registers and stack trace are available

Symbol search path is: srv*c:\symbols*http://msdl.microsoft.com/download/symbols
Executable search path is: D:\English\Win2002\ProRet\I386
Windows XP Kernel Version 2600 (Service Pack 3) MP (2 procs) Free x86 compatible
Product: WinNt, suite: TerminalServer SingleUserTS
Built by: 2600.xpsp_sp3_gdr.090206-1234
Machine Name:
Kernel base = 0x80800000 PsLoadedModuleList = 0x80886720
Debug session time: Sat Apr 18 17:27:23.031 2009 (GMT-4)
System Uptime: 0 days 9:15:49.622
Loading Kernel Symbols
...............................................................
................................................................
......................
Loading User Symbols
Loading unloaded module list
....................
*******************************************************************************
*                                                                             *
*                        Bugcheck Analysis                                    *
*                                                                             *
*******************************************************************************

Use !analyze -v to get detailed debugging information.

BugCheck C2, {7, cd4, 20, e0b724f0}


GetUlongFromAddress: unable to read from 8088ed50
Probably caused by : ntkrpamp.exe ( nt!ExFreePoolWithTag+2a3 )

Followup: MachineOwner
---------

0: kd> !analyze -v
*******************************************************************************
*                                                                             *
*                        Bugcheck Analysis                                    *
*                                                                             *
*******************************************************************************

BAD_POOL_CALLER (c2)
The current thread is making a bad pool request.  Typically this is at a bad IRQL level or double freeing the same allocation, etc.
Arguments:
Arg1: 00000007, Attempt to free pool which was already freed
Arg2: 00000cd4, (reserved)
Arg3: 00000020, Memory contents of the pool block
Arg4: e0b724f0, Address of the block of pool being deallocated

Debugging Details:
------------------

GetUlongFromAddress: unable to read from 8088ed50

POOL_ADDRESS:  e0b724f0 

BUGCHECK_STR:  0xc2_7

CUSTOMER_CRASH_COUNT:  2

DEFAULT_BUCKET_ID:  DRIVER_FAULT

PROCESS_NAME:  dopus.exe

LAST_CONTROL_TRANSFER:  from 80874583 to 80822f43

STACK_TEXT:  
9da7abec 80874583 000000c2 00000007 00000cd4 nt!KeBugCheckEx+0x1b
9da7ac3c 8095c9e9 e0b724f0 00000000 e3e864b8 nt!ExFreePoolWithTag+0x2a3
9da7ac58 8095d02b e3c90aa8 e3e864b8 e102f61c nt!CmpCleanUpKcbValueCache+0x3d
9da7ac6c 809656e6 e3c90aa8 e2236008 80965802 nt!CmpCleanUpKcbCacheWithLock+0x19
9da7ac78 80965802 9da7ac8c 8095d130 e3e864b8 nt!CmpGetDelayedCloseIndex+0x16
9da7ac80 8095d130 e3e864b8 9da7ac98 8095d572 nt!CmpAddToDelayedClose+0xa
9da7ac8c 8095d572 e3e864b8 9da7acb0 80960004 nt!CmpDereferenceKeyControlBlockWithLock+0x48
9da7ac98 80960004 e3e864b8 00000000 e1074480 nt!CmpDereferenceKeyControlBlock+0x12
9da7acb0 808e4472 e1074498 00000000 e1074480 nt!CmpDeleteKeyObject+0x92
9da7accc 8084f6da e1074498 00000000 000005f6 nt!ObpRemoveObjectRoutine+0xe0
9da7ace4 808e5347 8882f020 e4aa3ce0 8a2c4960 nt!ObfDereferenceObject+0x4c
9da7acfc 808e53dd e4aa3ce0 e1074498 000005f6 nt!ObpCloseHandleTableEntry+0x155
9da7ad44 808e5515 000005f6 00000001 00000000 nt!ObpCloseHandle+0x87
9da7ad58 8086a62c 000005f6 0379fe34 7c90e514 nt!NtClose+0x1d
9da7ad58 7c90e514 000005f6 0379fe34 7c90e514 nt!KiFastCallEntry+0xfc
WARNING: Frame IP not in any known module. Following frames may be wrong.
0379fe34 00000000 00000000 00000000 00000000 0x7c90e514


STACK_COMMAND:  kb

FOLLOWUP_IP: 
nt!ExFreePoolWithTag+2a3
80874583 8b45f8          mov     eax,dword ptr [ebp-8]

SYMBOL_STACK_INDEX:  1

SYMBOL_NAME:  nt!ExFreePoolWithTag+2a3

FOLLOWUP_NAME:  MachineOwner

MODULE_NAME: nt

IMAGE_NAME:  ntkrpamp.exe

DEBUG_FLR_IMAGE_TIMESTAMP:  498c11d3

FAILURE_BUCKET_ID:  0xc2_7_nt!ExFreePoolWithTag+2a3

BUCKET_ID:  0xc2_7_nt!ExFreePoolWithTag+2a3

Followup: MachineOwner
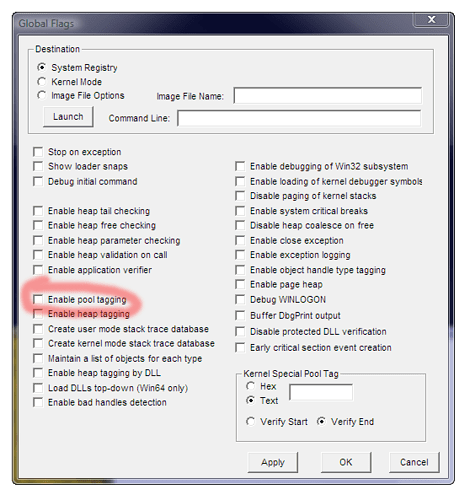
It'll be a driver or anti-virus bug since only kernel-mode stuff can cause BSODs.

(Drivers can be for things that provide virtual filesystems as well as physical hardware. e.g. TrueCrypt-like stuff, or ISO-mounting tools.)

If you're technically inclined, MS provide some tools that can help track down driver-level memory allocation errors. gflags (aka PageHeap) may be able to do it, though I'm not sure if it does driver level or not (I've only used it for non-driver debugging).

I think there's one called MemPool or PoolMon or something like that, as well, if you're on XP. (It's a pain to get on Vista as you need to download the huge DDK, but on XP I think it's on the install CD.) Not sure if that tool will help here or if its just for finding memory leaks in drivers.

If it was me, I'd start by checking for new versions of my anti-virus, hardware drivers (especially HDD controller and graphics) and stuff like TrueCrypt, Alcohol 120, Daemon Tools, etc. that has driver components. Or maybe check on their forums for "BAD_POOL_CALLER" and see if other people are having similar problems.

There are lots of Google hits for BAD_POOL_CALLER which might be worth a quick look in case you spot someone talking about it on the forum for something you use. I imagine a lot of the hits will be for random other things though.

BTW, each driver associates (or should associate) a "tag" with its memory allocations, and the crash being in ExFreePoolWithTag confirms it's tagged memory, so if you can find a way to get the tag reported then it should point to the driver. I'm not sure how you do that, though, as I've only read a little bit about debugging driver-level stuff.

Ah, on XP memory pool tagging is disabled by default. You can turn it on using GFlags either for dopus.exe or for the whole system. If you use the GUI version of GFlags then it should just be a checkbox you can turn on.

(Some info about GFlags and PoolMon is here: msdn.microsoft.com/en-us/library/cc265882.aspx )

If you do that, then wait for the crash to happen again, and then do the same thing with the new minidump, the windbg analyze output should include the memory pool tag (a 4-letter string) which you can then search for to find out which driver is probably responsible.

Here's an example output which includes the tag:

virtualbox.org/ticket/3168

The memory pool tagging is enabled by default (and AFAIK cannot be turned off) in Vista and some of the server versions of Windows so I imagine it won't harm performance much, if at all, to turn it on.


Thanks Leo this is helpful.

I'm not running any antivirus on this image to make sure it wasn't that.

On the 4 letter string that you are referring to where is that exactly?

In the example you provided can you tell me what specifically I would look at to determine root cause?

Thanks again.

Also "verifier.exe" has helped me before, it's in your system32 folder.

forums.techpowerup.com/showthread.php?t=12810
microsoft.com/whdc/DevTools/ ... ifier.mspx

[quote="jimerb"]On the 4 letter string that you are referring to where is that exactly?

In the example you provided can you tell me what specifically I would look at to determine root cause?[/quote]

1: kd> !analyze -v


  •                                                                         *
    
  •                    Bugcheck Analysis                                    *
    
  •                                                                         *
    

BAD_POOL_CALLER (c2)
The current thread is making a bad pool request. Typically this
is at a bad IRQL level or double freeing the same allocation, etc.
Arguments:
Arg1: 00000007, Attempt to free pool which was already freed
Arg2: 0000110b, (reserved)
Arg3: 080d0003, Memory contents of the pool block
Arg4: 872fb4f8, Address of the block of pool being deallocated

Debugging Details:

POOL_ADDRESS: 872fb4f8 Nonpaged pool

FREED_POOL_TAG: VBNF

BUGCHECK_STR: 0xc2_7_VBNF

DEFAULT_BUCKET_ID: VISTA_DRIVER_FAULT

PROCESS_NAME: System

CURRENT_IRQL: 0

LAST_CONTROL_TRANSFER: from 824fc00c to 824db0e3