The cursor in any window of any program jumps (skips frames) while the Dopus Lister is open. Jerks when moving happen every 3-5 seconds. Screen refresh rate 100Hz. Mouse polling frequency - 200Hz. I have NOD32 Antivirus (tried to turn it off). Therefore, I feel these jerks very well if I make circular movements on a clean background. With what it can be connected?
What does the CPU usage look like in Task Manager?
No remarkable CPU usage
What does the Task Manager Processes tab look like?
It looks like 300+ processes. We have to set search criteria.
A screenshot of the top of the list please.
order by what column?
Here is full list in Excel 2007 format
my procs.zip (68.2 KB)
We need some kind of internal logging. Procmon showed nothing interesting.
What Dopus can do every 3-5 seconds? Some kind of directory content change handling? Can we temporary switch it off?
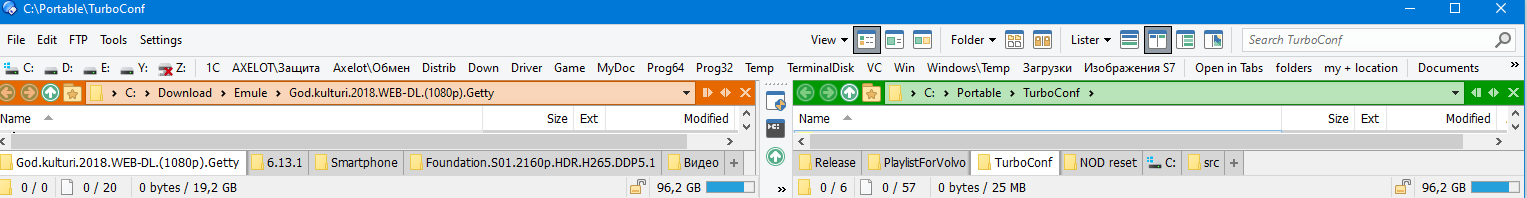
My lister look
Does it only happen when certain folders or tabs are open?
If your window really that short, or are you just making things look different for the screenshots?
Try closing any custom toolbars and scripts too.
It looks like there is some connection between the set of tabs (listed folders) and cursor jerks. And no connection to open toolbars.
If only 2 are tabs opened then jerks are less noticeable. If 10 tabs are opened then jerks are more noticeable even if all of tabs show the same folder.
Does it matter what the folder is that's open in all the tabs? (Or the type of folder, e.g. network vs local.)
Is there a lot of activity going on in the folder, or on the filesystem in general? (e.g. Something downloading or extracting a lot of data, or a big batch job on lots of files.)
Some process snapshots might reveal something about what's going on: Manually generating process snapshots
No matter what kind of folders are in tabs. I have only local folders. I tested 10 of "C:" folder tabs. No significant file system activity (no mass changes except of downloads and Firefox's permanent profile update ) .
I clearly remember that every time when I extracted thousands of files in temp folder - Dopus lister freezes for 30+ seconds and loads CPU core 100% all that time. It was in Dopus 11 and is in Dopus 12.
Dump is sent by email.
Nothing has arrived so far.
That's something we improved in 12, FWIW. But if there is a really extreme amount of filesystem activity to process then it can obviously still either result in a lot of CPU usage or in change events being dropped. It should not result in the mouse pointer skipping, though, which sounds more like the whole system getting overloaded. (Or possibly something resulting from using generic motherboard or GPU drivers instead of the correct ones, which I've seen in the past.)
Seeing that Task Manager screenshot would still be useful, to see if anything is using an extreme amount of memory, CPU, GPU or disk. Just open Task Manager and take a screenshot of the default, initial window.
Sent to wrong email. Resent to right one.
Yes I noticed no correlation with pointer jerks. But it looks unreasonably high cost (UI long not responding) for processing changes which are done in folders not visible in Dopus Listers. I plan create new ticket for this problem. And I feel this 2 problems have some connection.
I am sure there is no such processess. I exited all of them for test. But I feel that disk activity is one of components of problem cocktail.
No problem after OS reboot. I will try to figure out what event or application trigger the problem.
The snapshot showed the Opus process was completely idle and not doing anything.
So it may not even have involved Opus if it only happened once and was gone after the first reboot.
But there was only one snapshot sent, which may mean Opus happened to be idle when you took that snapshot even if it was sometimes doing other work.
If it starts happening again and you think Opus is involved, please make more snapshots. I don't know how much clearer we can make the instructions when they already contain this:

It'd be much easier if you just posted the Task Manager screenshot so we can see the information ourselves. Unless you have some kind of top-secret process in your task list which you can't close or something.
It happens regularly.
Many dumps just increases probability to catch something. And every next one adds less and less probability. So the first one is the most valuable. Next time I will make more of them.
If that something is short anough then 5-10-15 dumps will not be enough to catch it. And we still need logging (trace, debug, error).
It looks like Visual Studio Code in some state with Dopus are making this together. Usually I have 3 repositories opened in VS Code and all are in read only state. I will check if VS Code is the primary reason.