Thanks for the update and for adding GPU acceleration in the new viewer. The zooming does feel noticeably smoother than before, but I think there are still some underlying performance issues worth addressing.
System Specs:
CPU: 9800X3D
GPU: RTX 5070 Ti
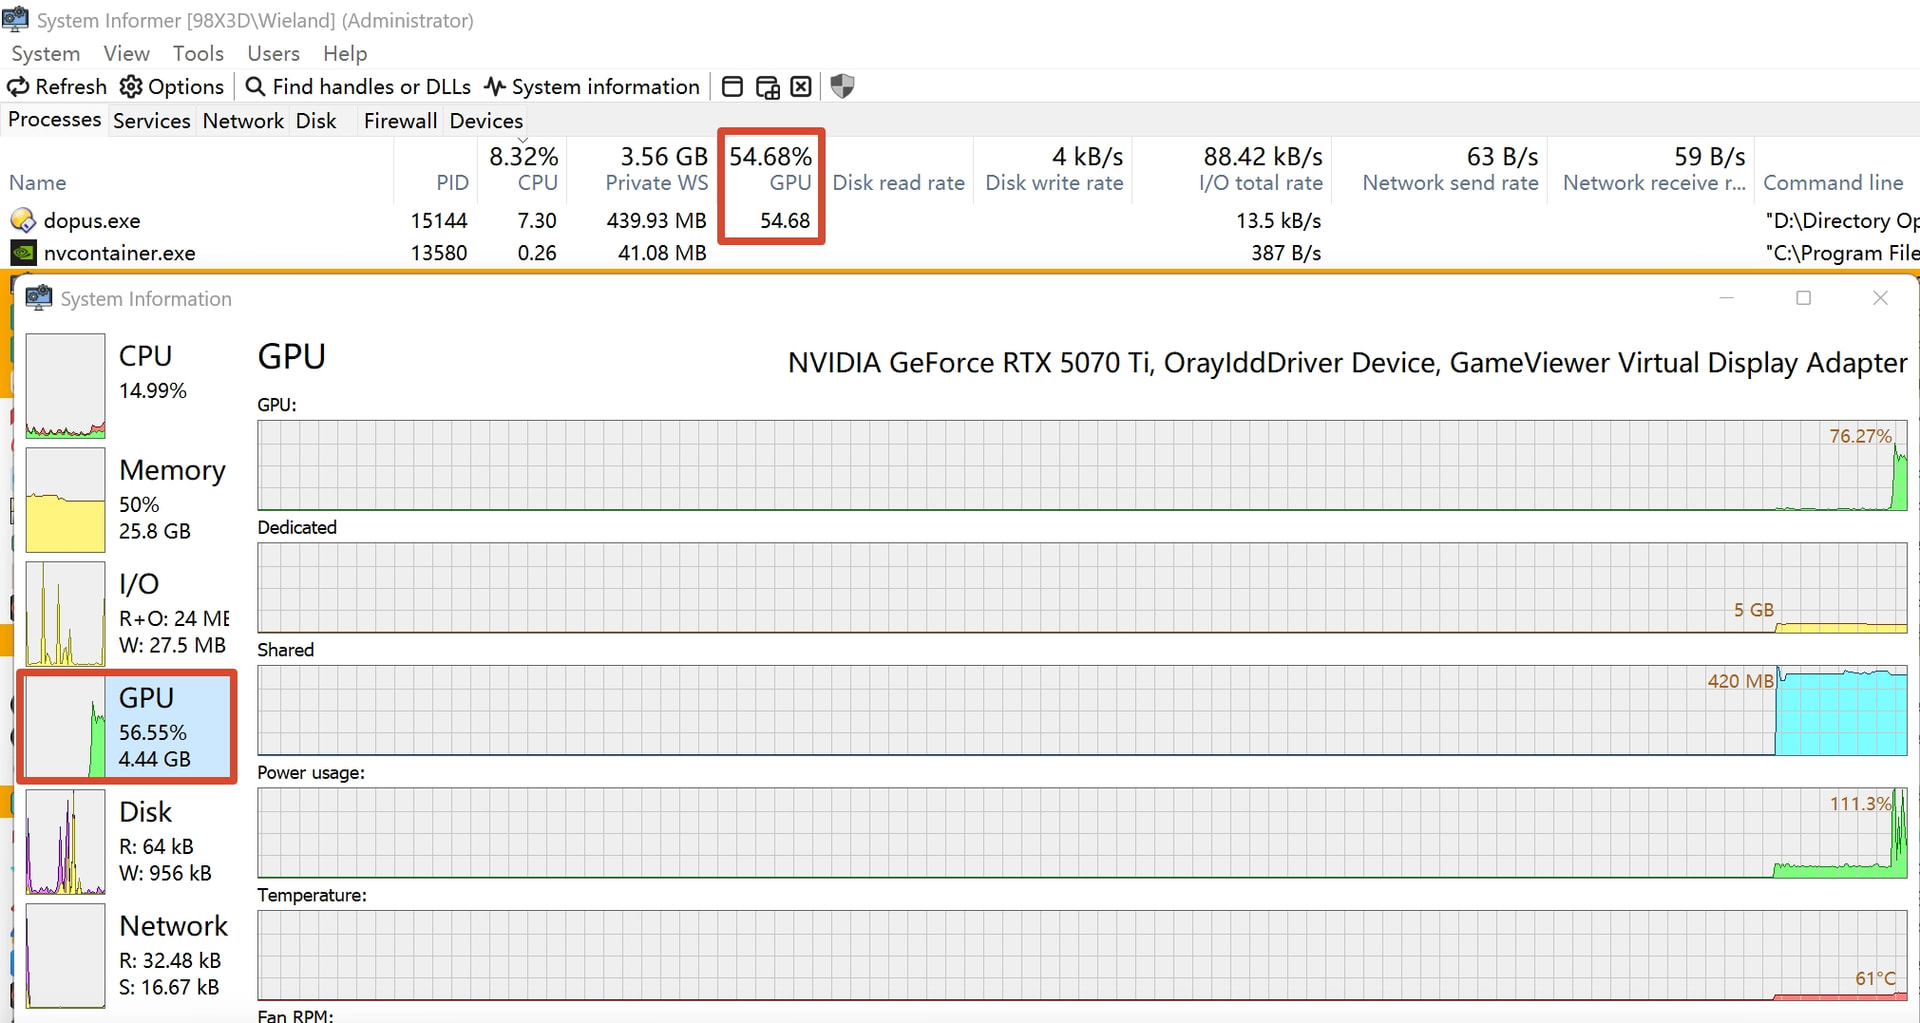
When rapidly zooming in and out of a 15MB 4K image using the mouse wheel, GPU usage spikes to around 55%. Given the hardware specs, this seems disproportionately high for a 2D image viewing task.
I understand GPU acceleration is meant to improve smoothness, but I'm not sure this is the most efficient implementation yet.
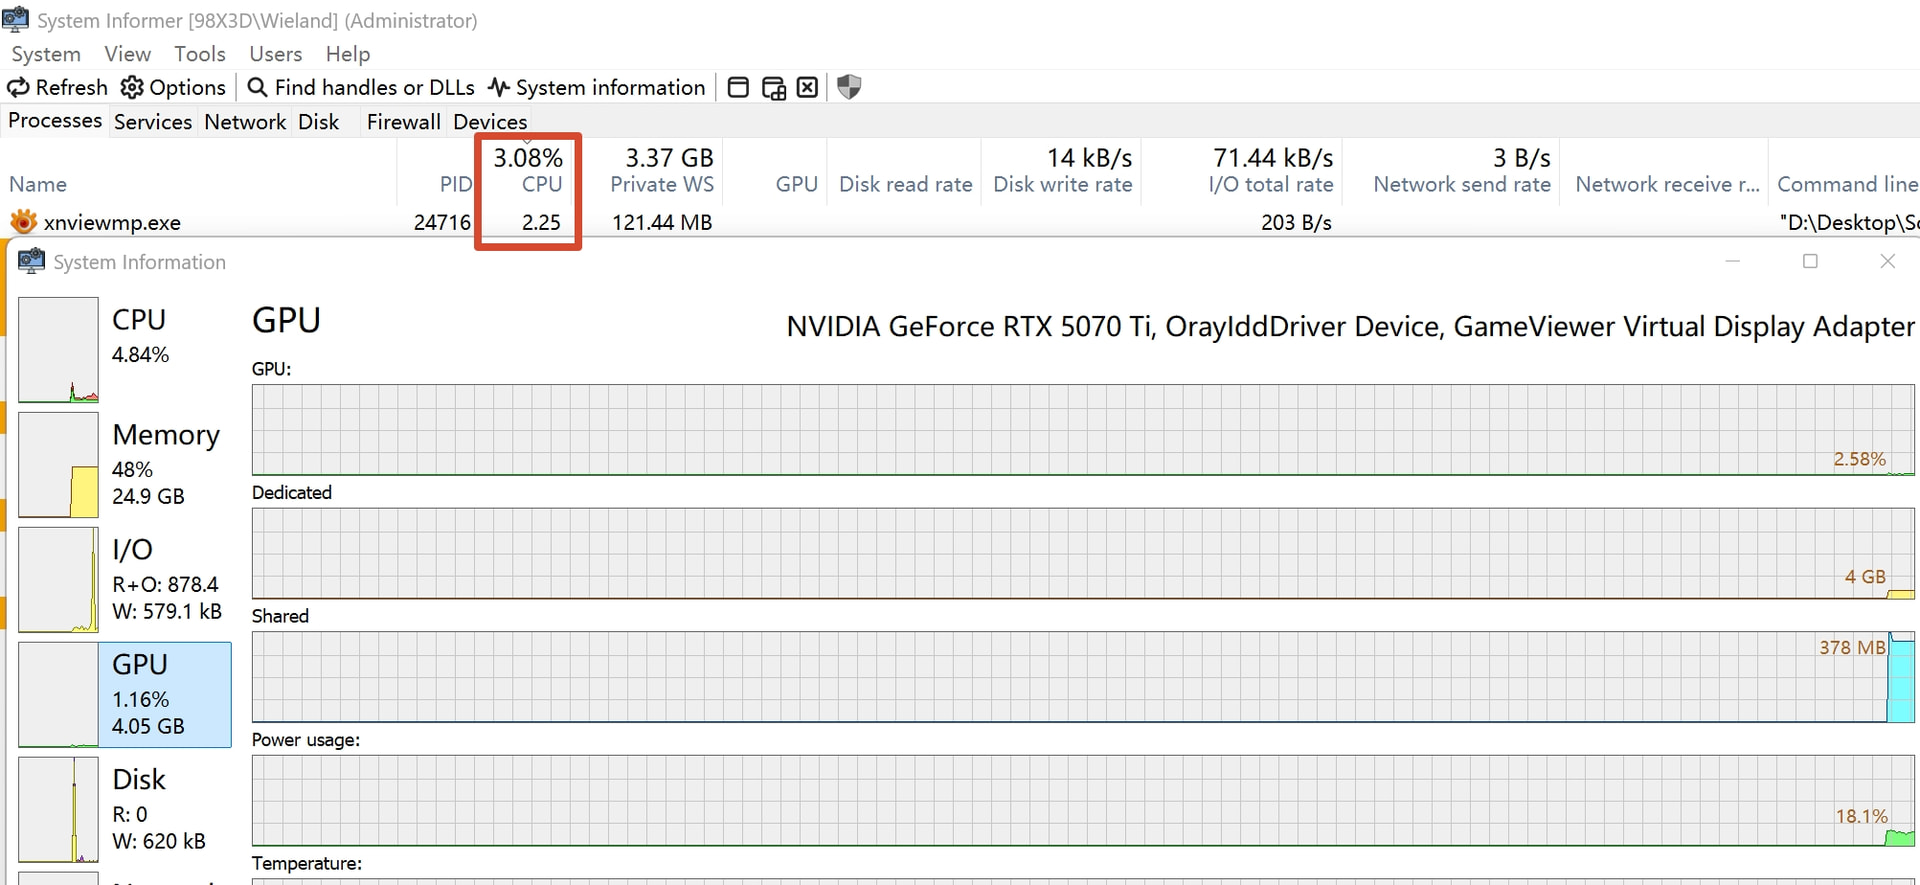
For comparison, performing the same rapid zoom on the same image in XnViewMP keeps CPU usage at around 3% with no measurable GPU load, while remaining perfectly fluid.
(I don't expect Directory Opus's viewer to replace a dedicated professional image tool, but seeing ~50% load on a high-end GPU suggests there's still room for optimization.)
That said, I do appreciate how quickly the GPU-accelerated viewer was released—it came much earlier than I expected. Thanks!
FWIW I tried zooming an 11520 x 2160 BMP (desktop screenshot of three 4K screens side by side; 32bpp; no transparency) as quickly as I could and only saw ~6% GPU usage.
Does it also happen for you when zooming via other methods? E.g. Set the viewer to Grow To Window mode and resize the window a lot. (For me that uses a little more, about ~10%. Screen is 120Hz which affect how often the resizes happen.)
My monitor normally runs at 3840 ×2160, 10bit, 120Hz. I tried changing it to 60Hz, but the GPU usage during mouse-wheel-zooming was still about 30%, sometimes jumping to 50%, which is the same behavior I saw at 120Hz.(at least, the load didn't decrease by half as one might expect).
I created a 10,000 x 10,000 pixel pure white JPG image in Photoshop, which is only about 500KB in file size. However, when rapidly zooming in and out (with the window size remaining constant), the GPU load stays around 60% most of the time and peaks at 80% sometimes.
I tried the "Grow to Window" mode and resized the window rapidly (the picture resized with the window as well). In this case, the GPU usage is much lower, peaking at around 8%.
I am using a Logitech G502. It has an infinite scroll mode, but I am not using it; I’m still using the standard notched scroll mode. I tested the polling rate across a range from 125Hz to 1000Hz, but the GPU usage didn't show any noticeable change, so that probably isn't a factor.
My GPU driver version is 591.86 (Release Date: Tue Jan 27, 2026). While it’s slightly behind, it’s not very old.
I’m using more or less the same mouse (G502-X I think), with the G-Hub drivers. Also tried with it in infinite scroll mode. We can rule that out a s a factor at least.
If you keep zooming for a while, does the GPU start/increase its fans or show higher temperatures or power usage? I wonder if it’s just Task Manager calculating the % in an unexpected way. If it’s really that high I would expect it to make the card run a bit hotter, at least.
I've discovered something else.
When using the zoom slider on the viewer toolbar, the GPU usage is very low—only around 2%, even though I tried my best to drag it back and forth as fast as possible.
However, as soon as I use the mouse wheel to zoom, the GPU usage becomes very high, just as I described above.
The CPU clock speed rises from its idle/base range of 2300MHz–4700MHz to frequently hitting its max of 5300MHz. Power consumption increases from 40W to 53W, and the CPU temperature climbs from 47°C to 52°C.
The GPU temperature rises from 38°C to 58°C, and the fan speed increases from 600 RPM to 800 RPM. Power consumption increases from 45W to 225W
I don't see anything above about 10% usage during the zoom either, but in the next beta we'll reduce the frame rate of the animation (at the moment it just runs as fast as it can, which is unnecessary) which should make a noticeable difference.
I found something interesting.
In the NVIDIA Control Panel under "3D Settings" > "Program Settings," I added dopus.exe and manually changed the "Max Frame Rate" option from the default "Off" to 120 FPS (60 FPS also works; the key is having a limit).
Miraculously, GPU usage dropped to around 3%, even when zooming with the mouse wheel. I tried the same with d8viewer.exe, but it had no effect. The problem is solved, though I'm not entirely sure why.
Yes, Direct2D is able to directly tie rendering to the refresh rate of the monitor. The animation runs over 150ms, previously on my machine it was hitting about 40 frames in that time, now it does 7 or 8.
Almost certainly that tool is reporting to you GPU usage relative to the current maximum clock speed or it's simply guessing (as many system resource tools outside of task manager tend to do). Task Manager itself even reports the single busiest SM group as the GPU utilization (even though the term implies an average).
The more accurate way to tell is to measure power usage (HWInfo is decent but better if you have physical power measurement hardware). A 5070 Ti will suck down 150w at 50% usage, do you see your power consumption spike 150w when looking at these images? If not, your software is misleading you.