When I open a network path via SMB in Directory Opus that contains a large number of subfolders (e.g., 3000 folders), the dopus.exe process commits an enormous amount of virtual memory. According to VMMap, this memory remains committed even after the directory contents have fully loaded and are no longer needed.
As a result, the system starts to slow down significantly, and if I open another similarly large folder, other applications on the system crash due to insufficient memory.
For instance, the Windows Event Viewer shows the following warning:
Windows successfully diagnosed a low virtual memory condition. The following programs consumed the most virtual memory: dopus.exe (21240) consumed 58,869,440,512 bytes...
The first non-Windows component listed is dopus.exe, indicating it is responsible for the excessive memory commitment.
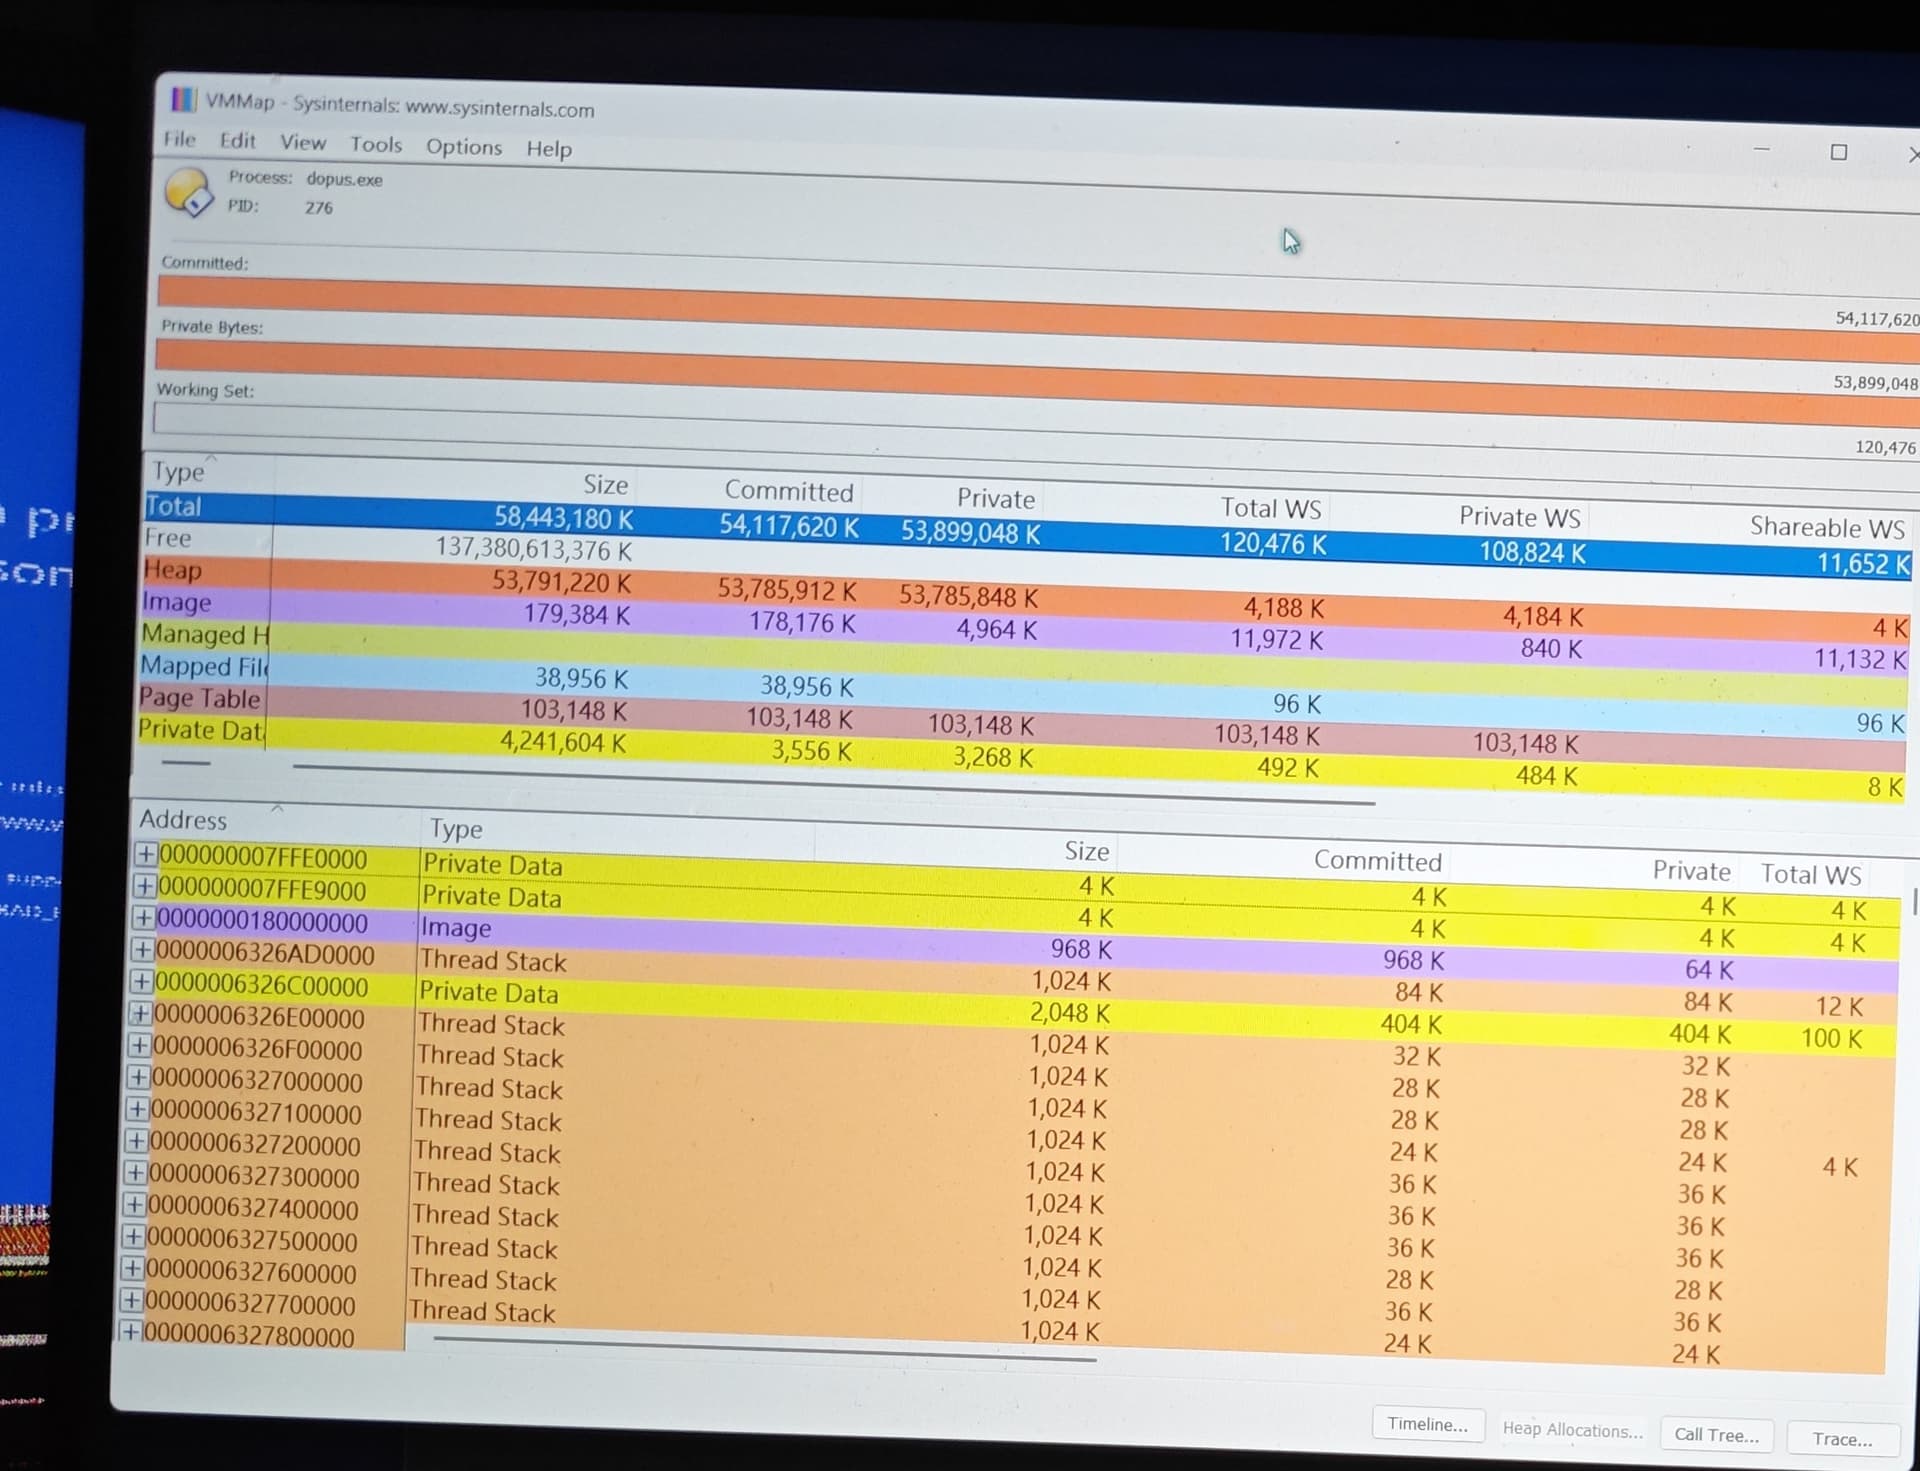
Using VMMap:
When browsing local paths with even thousands of subfolders, this issue does not occur—memory is committed temporarily and properly released after loading.
The problem only occurs on SMB network paths with large content.
When fewer items are present, memory is also released correctly.
I do not have any third-party plugins installed in Directory Opus.
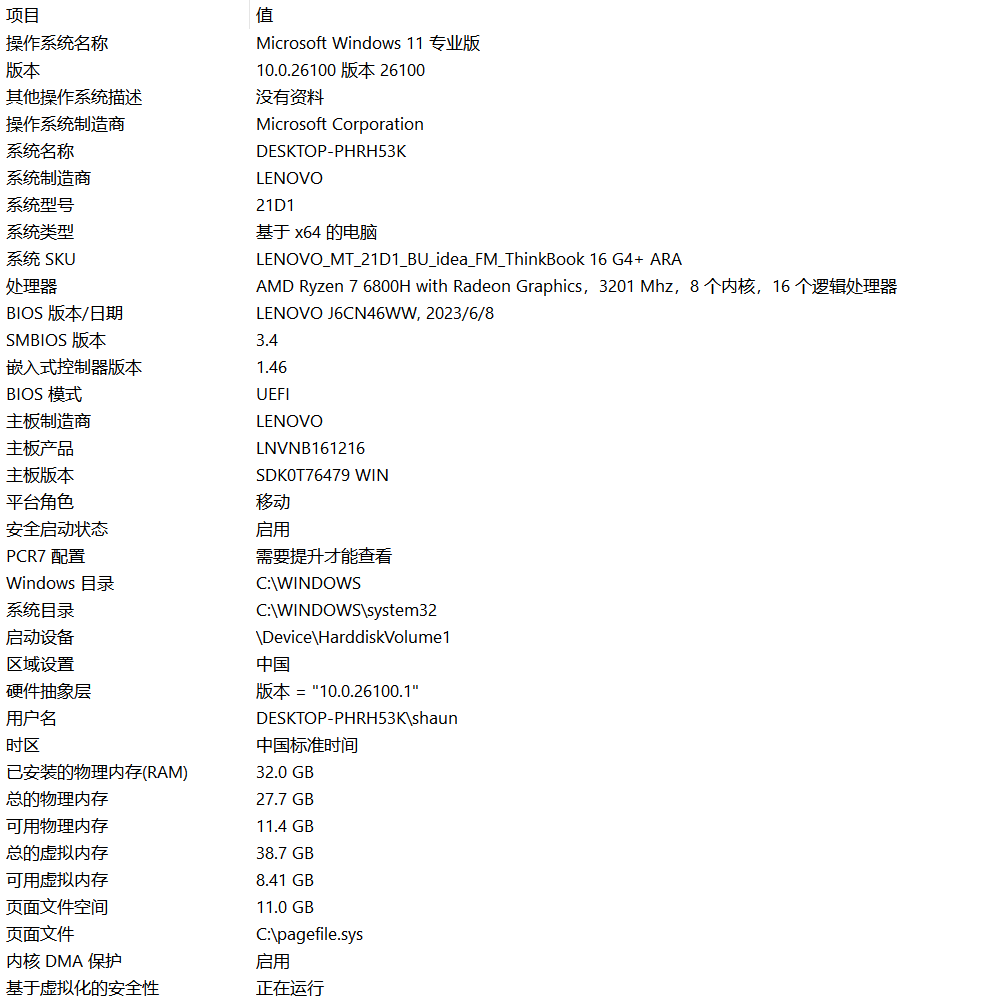
Environment:
Directory Opus version: Directory Opus 13.14 Build 9215 x64 | OS 10.0 (B:26100 P:2 T:1) SP 0.0
OS: Windows: Windows 11 professional, 24H2
CPU: AMD Ryzen 7 6800H with Radeon Graphics 3.20 GHz
Please advise if there’s any known fix, configuration tweak, or diagnostic method I can try to further narrow down the cause. This issue is currently severely affecting system stability when browsing large network directories.
BTY, I've noticed that when opening SMB network folders in Directory Opus, the loading speed is much slower than Windows File Explorer (As shown in the previous video). I’ve also compared it with a basic WebDAV browser I wrote using Python's webdav4 library — surprisingly, even that loads faster than DOpus in many cases.
Hopefully this can be improved in a future update.
Sorry, but I’ve tried multiple times and still wasn’t able to save the results — even with folders that contain fewer items.
Is there any workaround, or maybe some other info I could provide to help?
It's VMMap. It takes a loooong time but still failed to save the .mmp results. I can only save the .csv and .txt results. dopus.txt (114.2 KB) dopus.csv.txt (269.5 KB)
When the remote SMB folder was still loading in Directory Opus (abount 40G virtual memory was committed by dopus at that time), I saved vmmap's analysis results as file1. This operation took approximately 15 minutes to complete (significantly longer than expected).
After the SMB folder fully loaded in Directory Opus, I attempted to save another vmmap result as a .mmp file. vmmap.exe immediately entered a "Not Responding" state. VMMap.exe began consuming increasing amounts of system memory (see attached screenshot). After 4 hours, the memory usage had grown up to 18G, yet the export operation never completed.
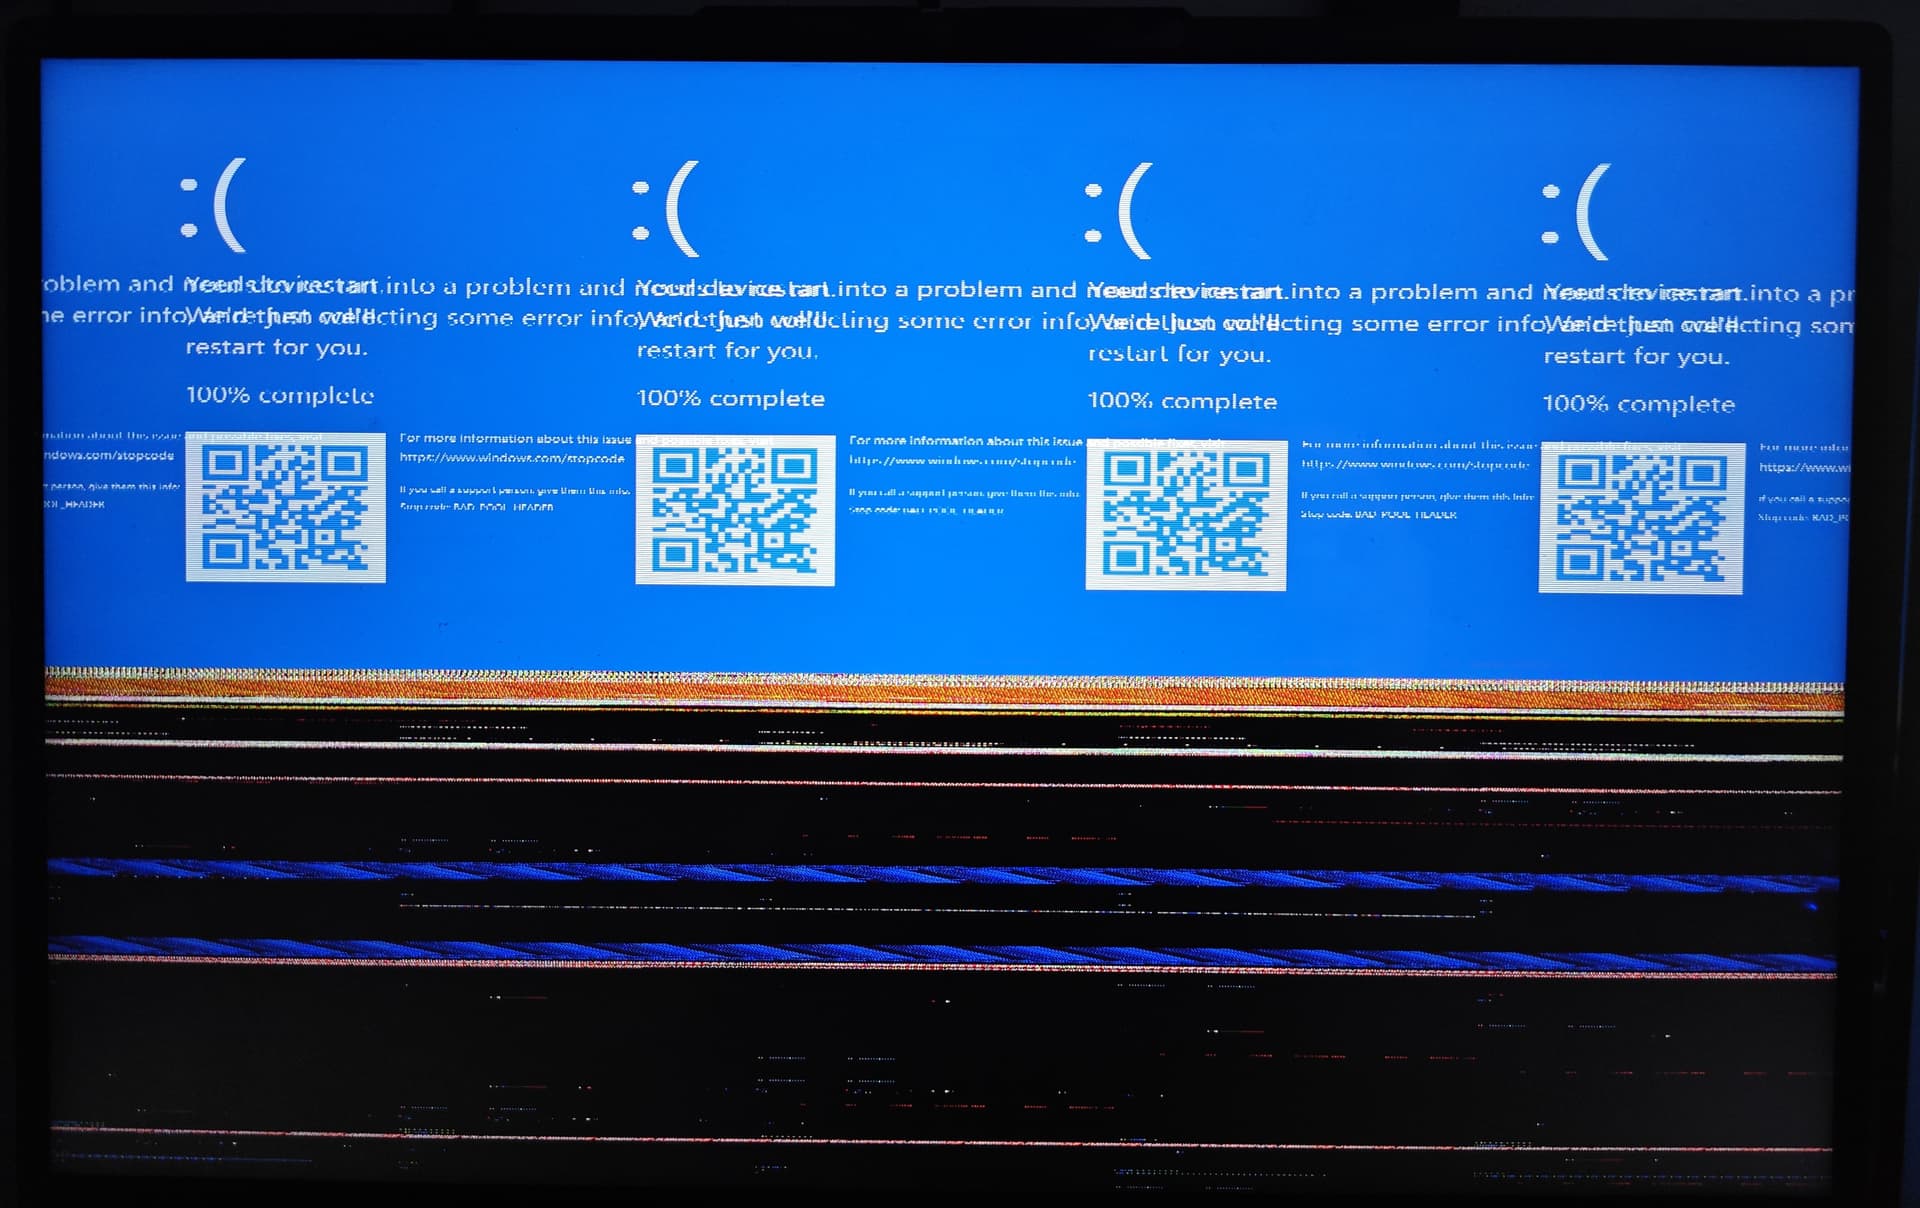
During a prior export attempt under similar conditions, the system triggered a Blue Screen of Death.
My ISP doesn't have IPV6. Is there another way to download the file?
Is this from a crash of Opus, VMMap or Windows itself?
The note about memory corruption makes me wonder if there's a hardware problem here. I don't think 302251 pages could become corrupted via a software bug (at least user-mode software like Opus). That might also explain why the BSOD itself is visually corrupted.
FWIW, the VMMap output shows that isn't the case. The dosv.dll viewer has been installed.
Unfortunately, VMMap doesn't save the stack trace information and will only display it "live", which surprised me (especially as SysInternal's other tool, ProcessMonitor, does save stack information to disk). Makes the tool a lot less useful for remote diagnosis.
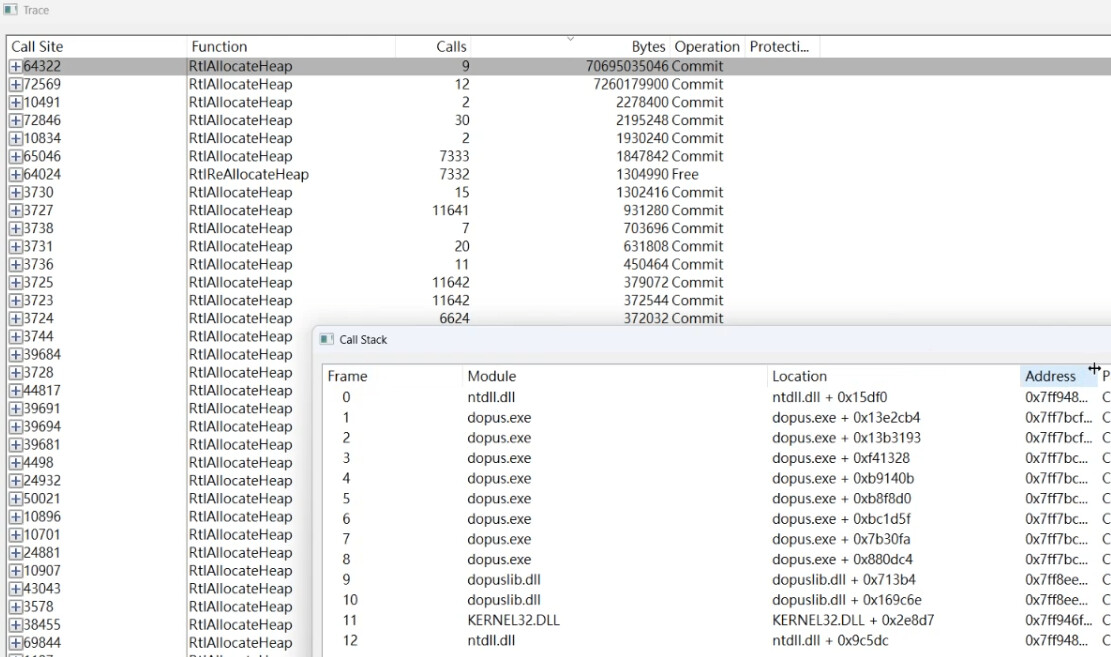
It'd be interesting to see the stack trace for some of the larger allocations, if you're able to get it to show that and screenshot it. (Please also make the columns wider if you do; VMMap's defaults are really narrow for some reason.)
Most of the large allocations are attributed to the Low Fragmentation Heap, but without the stack trace it's not clear what asked for the memory to be allocated.
There's also 4GB being allocated to Thread Environment Block, which seems very high. Does Task Manager's Details tab show a large number of threads running in the dopus.exe process? Or high CPU usage while it should be fairly idle?
I completely uninstalled and reinstalled Directory Opus. The attached video1.mp4 demonstrates this fresh installation. As you’ll observe, even without any additional plugins, Opus consumes significant memory when opening the SMB directory, while Windows Explorer handles the same directory smoothly.
video1.mp4 compares the performance of Windows Explorer and Opus opening the identical SMB directory. video2.mp4 is supplementary footage since I’d forgotten to show stack details in video1.mp4.
Could you tell me the version of Opus that was running in the video? (E.g. 13.15.3) With that I should be able to work out which code is at those offsets.