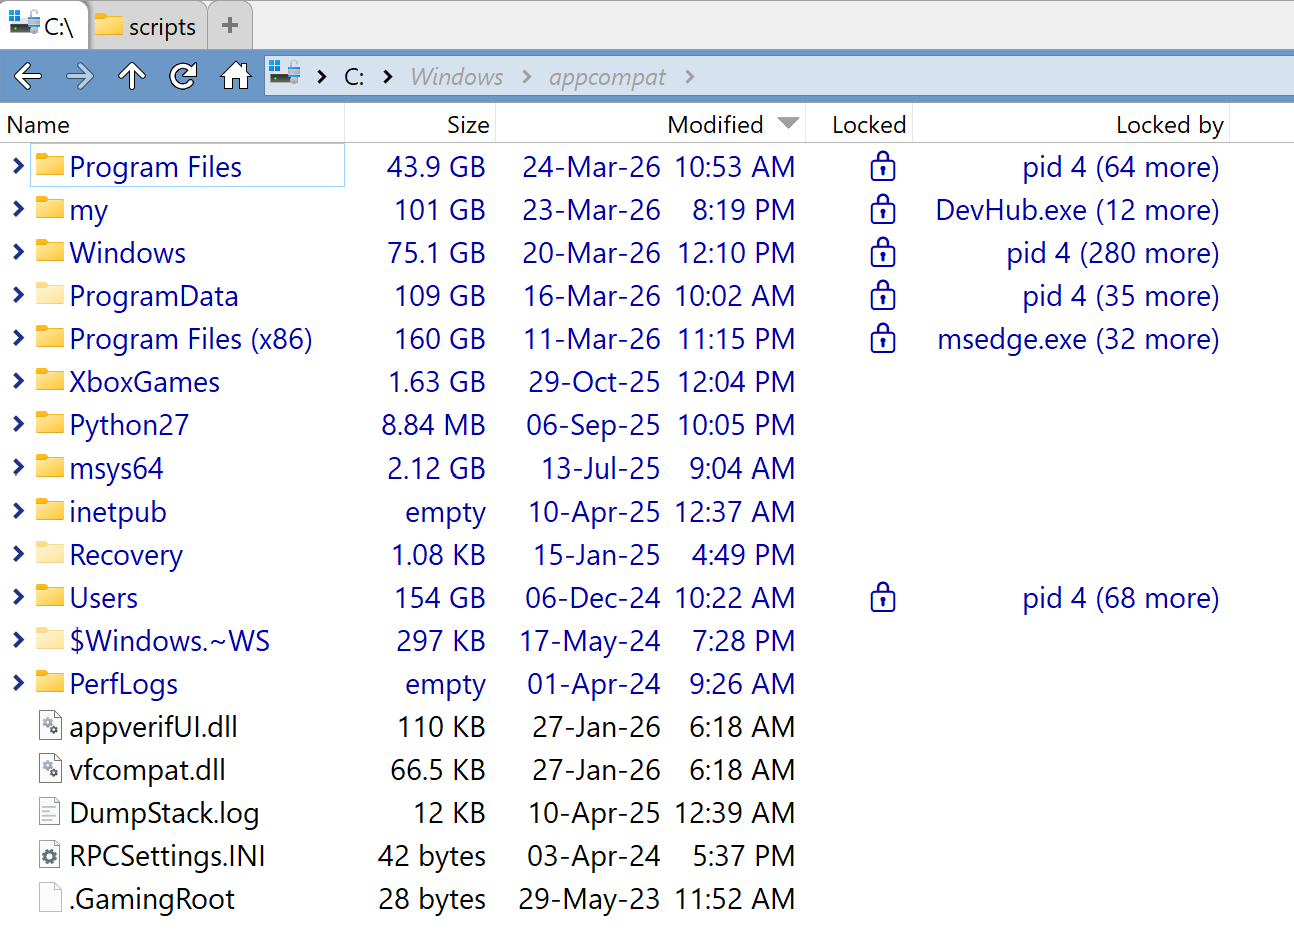
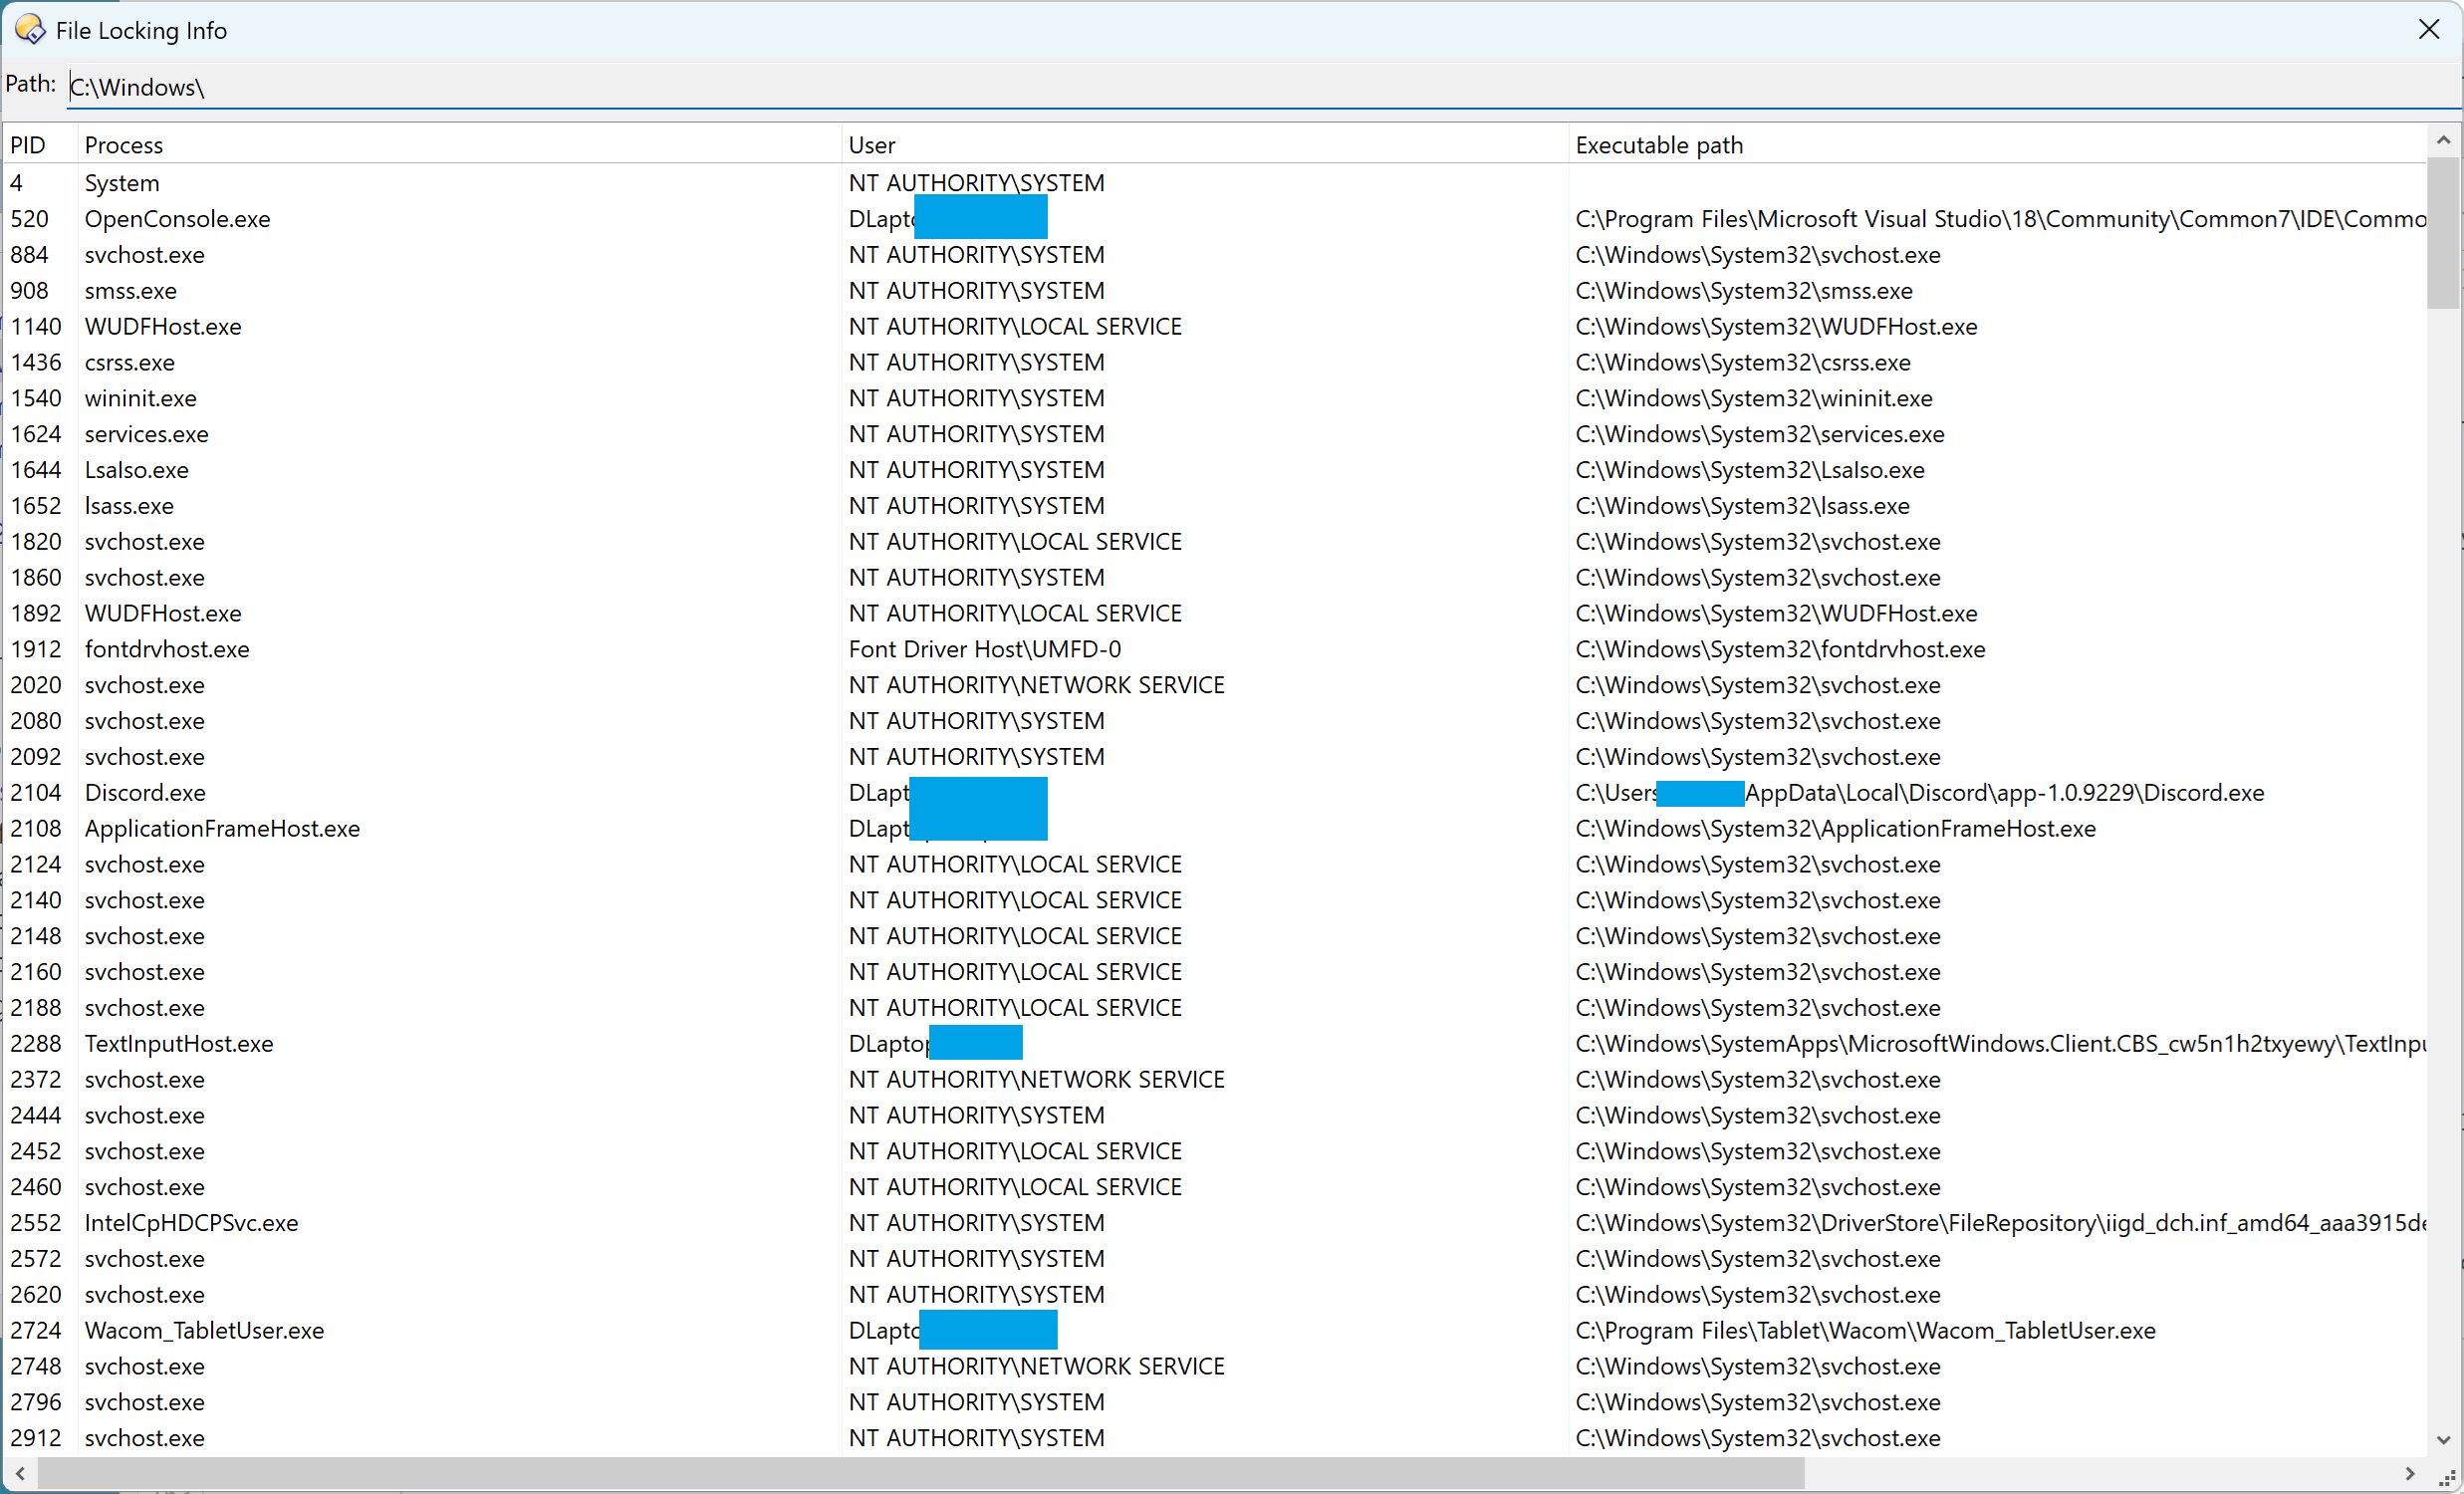
Current progress. The code works. It shows the locked status almost instantaneously. Even a folder like C:\Windows\System32 is tolerable, even though there is a huge amount of files. The only drawback is that the info is about 8-10 seconds out of date: it takes 3 seconds to get all handles and modules in the system, and I added a 5 second sleep between updates to avoid spamming the CPU.
I suspect most PC's aren't as fast as yours but I don't think time delays matter much for this kind of thing.
I suspect most PC's aren't as fast as yours but I don't think time delays matter much for this kind of thing.
Yes, but it still will be fast to show the data. Only background loop that updates the cache will be slower. 99% of the time you want to delete a file that was locked for more than 10 seconds.
Sorry for being away, I'd accumulated work to do.
For me, it would mostly be used in "Command mode": a dialog that lets you do the most common things you might want to do with a locked file (unlock it, schedule delete/move, etc).
The last version I made this past Sunday basically follows this approach:
For information only (columns), it grabs a list of all locked files for all processes (within allowed permissions). Then it simply checks whether a specific file is on that list and shows some info about it. This works well with how user columns work in Opus. For a more complete list, you may need admin privileges (which is a configurable toggle).
There's also an infotip-only column that can query the info just for the item in question. The good thing about this is that you don't need admin privileges.
The "command mode" works as a server (basically, the Python part creates a local server). That's because if you ever need to elevate privileges, it will only ask once per command call, instead of asking for every task that requires elevation. Several "clients" can then use that server, so the UAC prompt will only show once. And every client sends a heartbeat on a timer; if no heartbeat is received for 30 seconds, the server auto-closes.
That does look really good indeed. But does that mean it's constantly running and gathering data, am I right?
What does the "more" value mean? That the "Windows" folder is locked by 281 processes (very unlikely), or that the folder also contains at least 280 items that are also locked?
It does only if Opus is opened and created my C++ COM class. Otherwise, nothing happens. You don't pay for what you don't use.
However, if you open Opus that uses my C++ COM class and it runs in the background, then every 5 seconds, the cache will be updated.
It is similar to Search Everything: it always updates its cache, even if you don't use it.
What does the "more" value mean? That the "Windows" folder is locked by 281 processes (very unlikely), or that the folder also contains at least 280 items that are also locked?
It means "there are another 250 processes locking this folder". I just can't display the full list inside the column. Thus, I show only 1. In my case, it is actually true. I have a huge amount of processes for some reasons  And it includes processes that run as an admin and a System user.
By the way by "locking a folder" I mean:
- A process literally locks a folder (f.e. you open Powershell inside a folder)
- A process locks some file inside this folder recursively
Interesting. I'm not familiar with SearchEverything (is this utility?).
But does your implementation have a way to explicitly ask it to close? That could be helpful, if possible of course.
does your implementation have a way to explicitly ask it to close?
Right now, not. But it is very easy to add. Now I just want to make something work. I will add it to the to-do list.
SearchEverything
Sorry, I meant this voidtools Everything
Those seem like GitHub problems rather than C++ ones. GitHub has a lot of flaws.
Want to add:
It is more of a C++ ecosystem issue, because the package manager vcpkg made by Microsoft doesn't support Windows properly
My project is maybe 1000 lines of code. It is not much, mostly boilerplate. But it takes 4 hours to build on a beefy GitHub Actions machine. It is C++ for you (it is because of 3rd party libraries)
No machine is powerful enough. There is a whole company Incredibuild that earns a lot of money just because C++ is so painfully slow. You literally have to have a cluster of 100s of machines just to make code compile in a reasonable time
C++ can build very quickly. Opus and its dependencies are millions of lines of C/C++ code and headers but compile in only 1m30s (debug) or 04m43s (optimized/release) on a 9950X3D (16C/32T).
Precompiled headers help a lot, FWIW.
C++ can build very quickly. Opus and its dependencies are millions of lines of C/C++ code and headers but compile in only 1m30s (debug) or 04m43s (optimized/release) on a 9950X3D (16C/32T).
Wow. This is actually impressive. Great job.
Yes, I use precompiled headers.
But what I wrote is partly a joke. In my case, it is just the 3rd-party dependencies that take so much time. vcpkg compiles them from scratch, and I actually think it does so very inefficiently, because it recreates the build environment for every package.
But only the from-scratch builds are that bad. Incremental builds are fast.
If you don't have heavy 3rd party dependencies, then the speed will be fast, but honestly, still impressive in your case, how fast you manage to build such a huge app.
Given that you expose the PID's, it occurs to me that this is a good opportunity for targeted on demand memory scanning using PE-sieve or Hollows Hunter. I have attached a slightly modified version of your script that uses Hollows Hunter to do this. Just proof of concept/not polished.
DirectoryOpus-FileLockingInfo-columns-and-dialog.opusscriptinstall (3.9 KB)
Interesting.
What does it do?
It is a command line memory scanner for finding suspicious code injected into running processes. Ordinarily it scans the entire system which can be slow, but if you are only concerned that a specific program/process might be malicious, it is helpful to just be able to only scan the processes touching that particular file. It basically detects indicators of compromise for running processes. It is useful for detecting fileless malware or packed executables etc. As applied here, I just pass all of the pids touching a particular file to hollows hunter and it shows whether any of them are concerning and why. This is uniquely helpful because most antivirus programs are weak in this particular domain. It is something that needs to be done on demand and being able to do it in such a targeted way is actually quite unique since you need to pass pids rather than paths, which makes anything other that system wide scans awkward, but your approach actually gives a helpful way of making it less so.
There are convenient ways of doing it at the system level like hollows hunter, Thor-lite, and loki-rs, but that takes too long for my liking. It also produces a lot of noise, by flagging processes that you know are benign, and that are completely unrelated to your concern.
I realized something. It's true that trying to get this kind of information in a fully complete way is kind of a lost cause. But then I saw that, thanks to the amazing work by @PolarGoose, who basically did all the heavy lifting, you can now use the driver directly even from a Python script.
And that's also when I understood why you chose to keep a constantly updated cache.
Since my user case is kinf of recreational, I implemented it like this: there's a service (written in Python) that handles the heavy work, and a bridge (also in Python) that takes care of communication between the service and Opus. Even though the service can run in the background all the time, it doesn't cache continuously, so that's not an issue anymore.
Whenever Opus ask for the data, it gets cached (e.g. for 5 seconds). For columns, this works well for me, since I can get fresh data in about 3 seconds.
When using the dialog, the service runs a server. In that case, it does continuously cache the data, but only while the server is active (the service auto-detects this once there are no more clients connected). With this, I've effectively solved the constant CPU usage I had with the original plugin.
Thanks a lot for your great work and more importantly to share this with others.
Interesting approach. Good job on making this work in Python.
Just a heads up that this script will error in 13.22.5 because of this change:
Improved the checks Vars.Set() does to detect non-Opus objects (they are not supported in Vars objects as they can easily cause crashes, since they can't persist from one instance of a script to another).
We previously checked for variables that were added directly to Vars and rejected non-Opus objects (e.g. jscript arrays), but we now also check for non-Opus objects hidden inside Opus ones (e.g. in a Vector).
Using jscript objects in a Vars object doesn't work reliably (and often crashes) because the objects are linked to the instance of the script engine that created them. Objects will remain in memory because of their refcount, but if the jscript garbage collector runs after that instance has shut down, the memory underlying them is released and the object now points to unallocated memory.
If you need to persist non-Opus objects from one instance of a script to another the only safe way is by serialising them (e.g. to JSON). Or e.g. use an Opus object like a Vector instead of a jscript array.